


Strengthening R&D confidence through oven temperature mapping

When a UK food manufacturer needed greater confidence in the performance of its R&D ovens, it turned to MWS for a structured temperature mapping solution. The result was clear, traceable evidence that its cooking processes were controlled, consistent and fit for purpose.
Customer Profile
Our client is a UK-based food manufacturer with a dedicated research and development facility responsible for designing and testing cooking processes for prepared food products. In this environment, accuracy matters. Cooking instructions printed on packaging must be supported by reliable, repeatable testing carried out under controlled conditions.
The site operates several domestic-style ovens within its R&D kitchen, used to validate cooking times and temperatures before products are released to market.

The Challenge
When developing new products, the R&D team must be confident that stated cooking instructions consistently achieve the required core temperature. For example, if packaging states that a product should be cooked at 180°C for 25 minutes, the team needs clear evidence that this process delivers safe and consistent results.
Historically, the team relied on a single mechanical temperature logger positioned in the centre of the oven. While this provided a basic temperature reading, it only measured one point and did not offer a complete picture of temperature distribution throughout the oven cavity. To build a more detailed understanding, staff would have needed to manually reposition the logger and record readings over time, a process that could take days and still leave gaps in coverage.
In addition, the client wanted documented, traceable evidence to demonstrate that their R&D processes were controlled and robust. Simply confirming that food “cooks properly” is not sufficient in a regulated environment.
The Solution
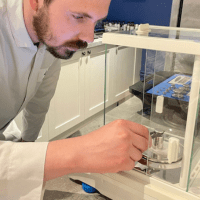
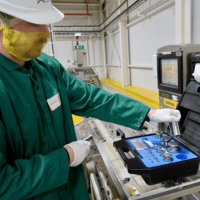
Micro Weighing Solutions (MWS), already supporting the client with weighing calibrations, was approached to carry out oven temperature mapping across five domestic ovens within the R&D facility.
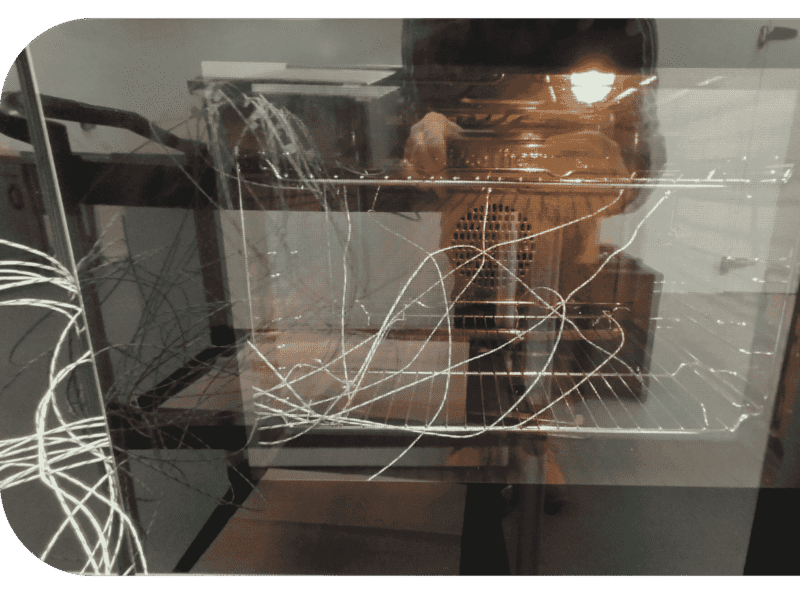
A standard nine-point mapping configuration was used for each oven to provide a full profile of temperature distribution. This approach ensured coverage from top to bottom and from front to back, rather than relying on a single central reading.
Each oven was monitored over the course of an hour, with data logged automatically at 30-second intervals.
The mapping captured:
- Heat-up phase
- Stabilisation period
- Ongoing temperature cycling
The resulting data produced clear graphical reports showing how each oven heated, cooled and cycled over time.
All equipment used for the mapping was UKAS traceable, ensuring that the results provided documented evidence suitable for quality records and audits.

Results
All five ovens were found to be operating within expected tolerances for domestic equipment. As anticipated, temperature fluctuations of around 10°C were observed during normal cycling, even in brand new units. Importantly, the variation was consistent and within acceptable limits for the intended R&D application.
The mapping delivered clear benefits. The R&D team can now demonstrate even heating and identify any hot or cold spots, supporting accurate validation of cooking instructions. Each oven has a time-stamped temperature profile, providing traceable evidence for quality systems and audits. Automated logging improved efficiency by removing manual recording, while establishing a performance baseline enables proactive maintenance decisions. By highlighting uneven heating or potential hotspots, the process also reduces the risk of under-cooking, overheating and unnecessary equipment wear.
RESULTS


Conclusion
For this food manufacturer, oven mapping provided clarity.
Rather than relying on a single temperature reading, the R&D team now has a complete picture of how their ovens perform over time and across multiple positions. They can demonstrate that cooking processes are validated, controlled and traceable.
Even new ovens fluctuate. What matters is understanding how and by how much.
With structured temperature mapping in place, the client has strengthened the foundation of its product development process and created a clear benchmark for future performance monitoring.